Introduction
Purpose: Explains how to evaluate and run side mirror noise simulations in vehicle aeroacoustics, highlighting key considerations.
Supporting material: Includes a detailed guideline document and a simulation template.
Audience: Anyone running side mirror noise cases using Simcenter.
Vehicle Aeroacoustics with Simcenter
Focus Areas



Side Mirror Aeroacoustics
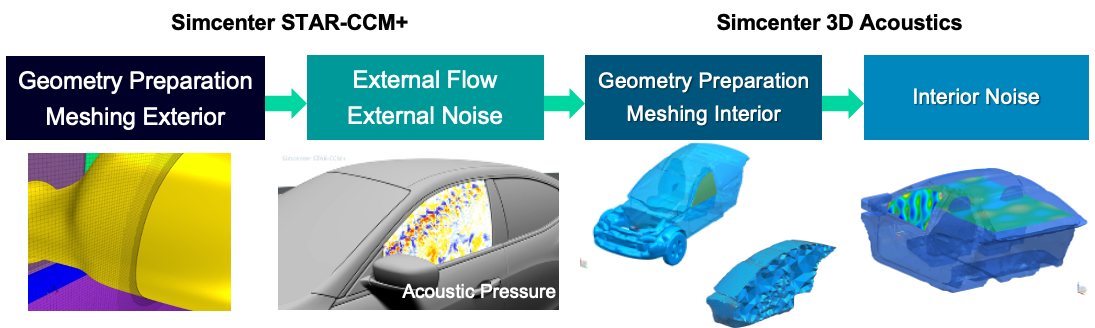
- Cabin noise above 1.5 kHz for side mirror aeroacoustics requires coupling Simcenter STAR-CCM+ with Simcenter 3D Acoustics.
- STAR-CCM+ exports time-step CGNS files (pressure on side window).
- These files are used as boundary conditions in Simcenter 3D (lighter export from v2310 onward).
Buffeting
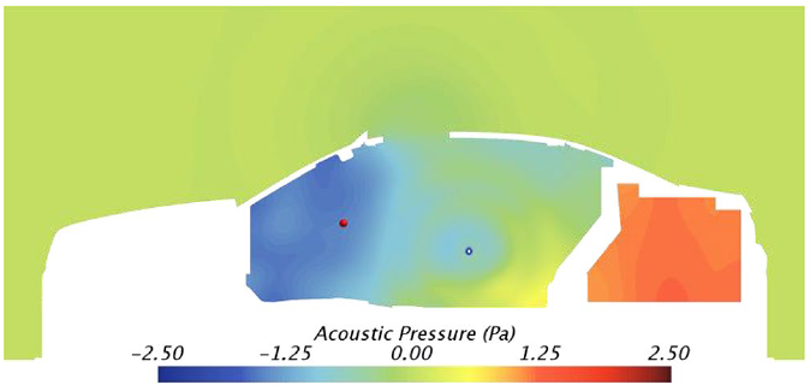
- Buffeting is caused by flow–acoustic feedback at the sunroof opening (two-way coupling).
- Requires compressible flow and a Direct Noise approach (stricter than hybrid methods).
- Produces very low-frequency (<50 Hz), high-amplitude interior noise.
Underbody Noise
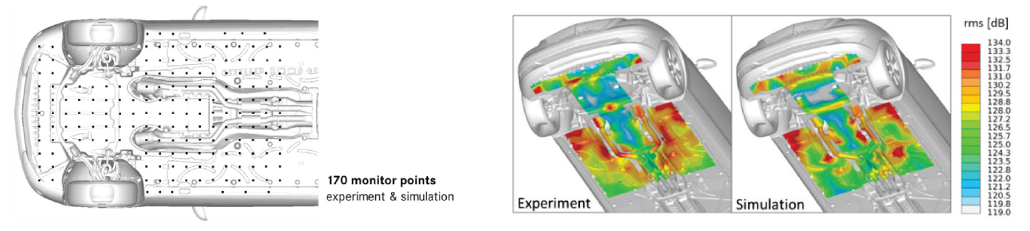
- Transient underbody pressure loads generate low-frequency noise (<1 kHz).
- Acoustic wave equation is solved alongside the transient flow field.
- Accurate turbulence prediction is critical.
- Cabin response is highly sensitive to underbody structural design changes.
- Requires coupling Simcenter STAR-CCM+ with Simcenter 3D Acoustics.
How to Run: Side Mirror Aeroacoustics Checklist



Only if you can tick all three boxes, the aeroacoustics project can be started.
Missing information can delay or result in big discrepancies later in the project.
Experimental / Measurement Setup
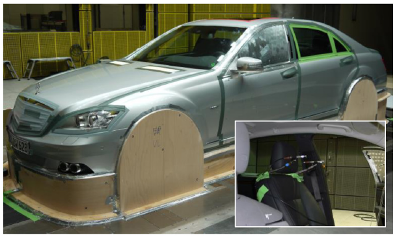
Define a proper experimental setup and test object, starting with a skirted configuration (sealed engine bay and underbody) to reduce complexity. Including the underhood compartment increases CFD difficulty and the risk of poor mesh quality and stability issues. Avoid comparing non-skirted measurements with skirted simulation results. Focus on delta prediction rather than absolute values by evaluating mirror variants or modifications that create clear differences, and seal all relevant gaps to minimize uncertainties.
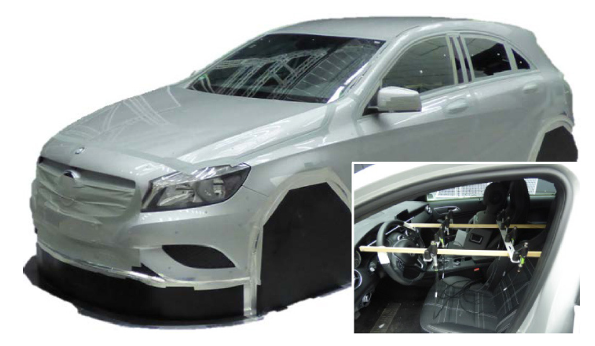
Define the experimental setup and test object clearly, deciding between full or half car; a half car setup is preferred due to reduced runtime. In half-car tests, isolate the driver side (e.g., foam, heavy mats). Side window noise typically dominates over the windshield, as the windshield is glued and contributes less vibration, though CGNS datasets can include separate boundaries for both if needed. Carefully review experimental photos, especially gap sealing and tape locations, since reproducing these details accurately in the simulation is critical.
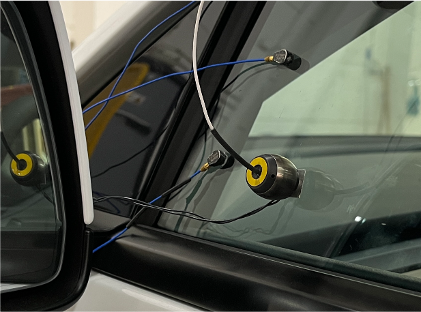
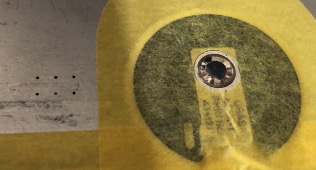
Clearly document the measurement and sensor setup before starting. Confirm whether sensors are placed on the side window, identify the sensor type (make, model, membrane diameter), and gather all details needed for post-processing, especially for membrane surface averaging. Check if volume microphones or intensity probes are used. Ensure access to the experimental raw data pressure time signals, not pre-processed spectra or bands to avoid discrepancies in post-processing that could lead to incorrect conclusions when comparing experimental and numerical results.
CAD Geometry / CFD Model
CAD geometry
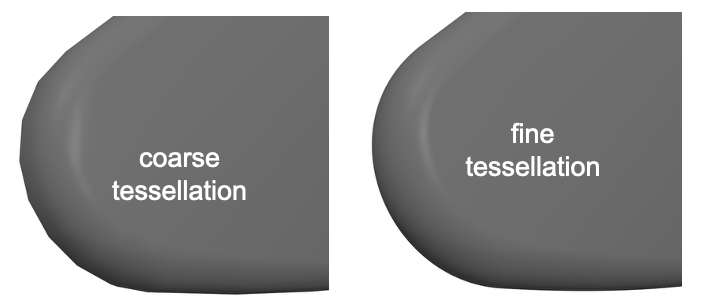
All critical surfaces must be finely tessellated down to 0.75 mm where needed to capture curvature, including the A-pillar, side window, side mirror and its base. A coarse surface mesh can cause unphysical flow separation. Accurately reproduce the experimental gap patching by carefully reviewing available photos, including details such as the skirt and other components. Whenever possible, use a high-quality watertight surface to minimize geometry preparation and surface wrapping efforts.
CFD model
- Make sure that all boundary conditions are known
- Use the existing side mirror aeroacoustics template (reach out to your support engineer)
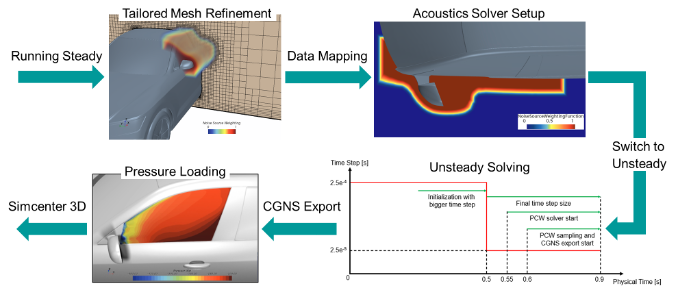
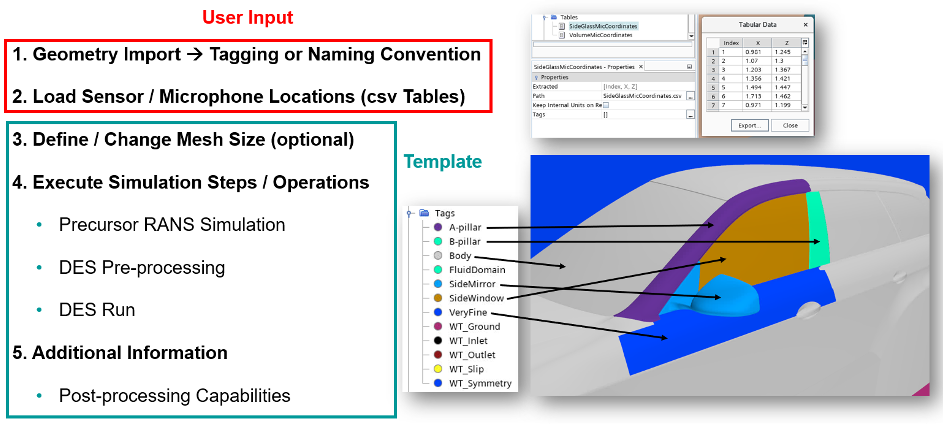
- CGNS file export at each time step (hydrodynamic and acoustic pressure) -> for more information, please review the guideline / overview document for side mirror noise (ask your support engineer)
- Imported in Simcenter 3D Acoustics -> used as boundary conditions (load) for the structural/acoustics analysis
Structural / NVH Model
Benchmark / Evaluation Process
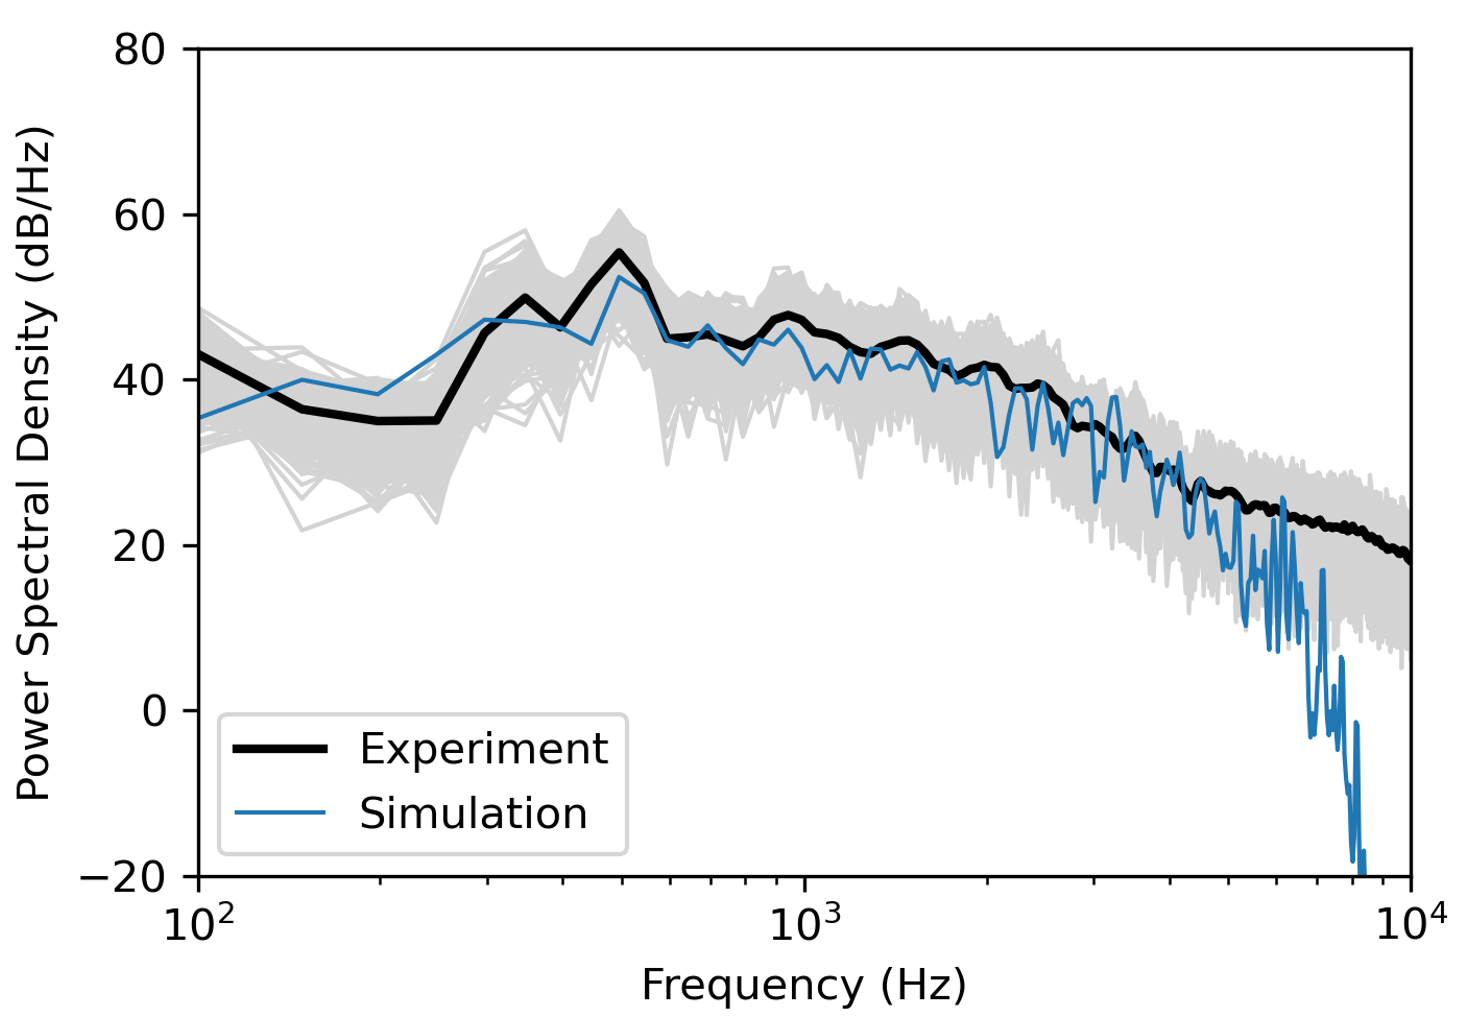
Post-processing is critical and often misunderstood. Different settings can greatly affect results, so ensure an apples-to-apples comparison by processing both the experimental raw signal and numerical results in the same tool with identical settings. Use the pressure time signal for proper comparison and create an experimental scatter band, remembering that experimental signals are typically much longer than numerical ones. Review additional technical details in the provided slides.
Experimental / Measurement Sensor Setup
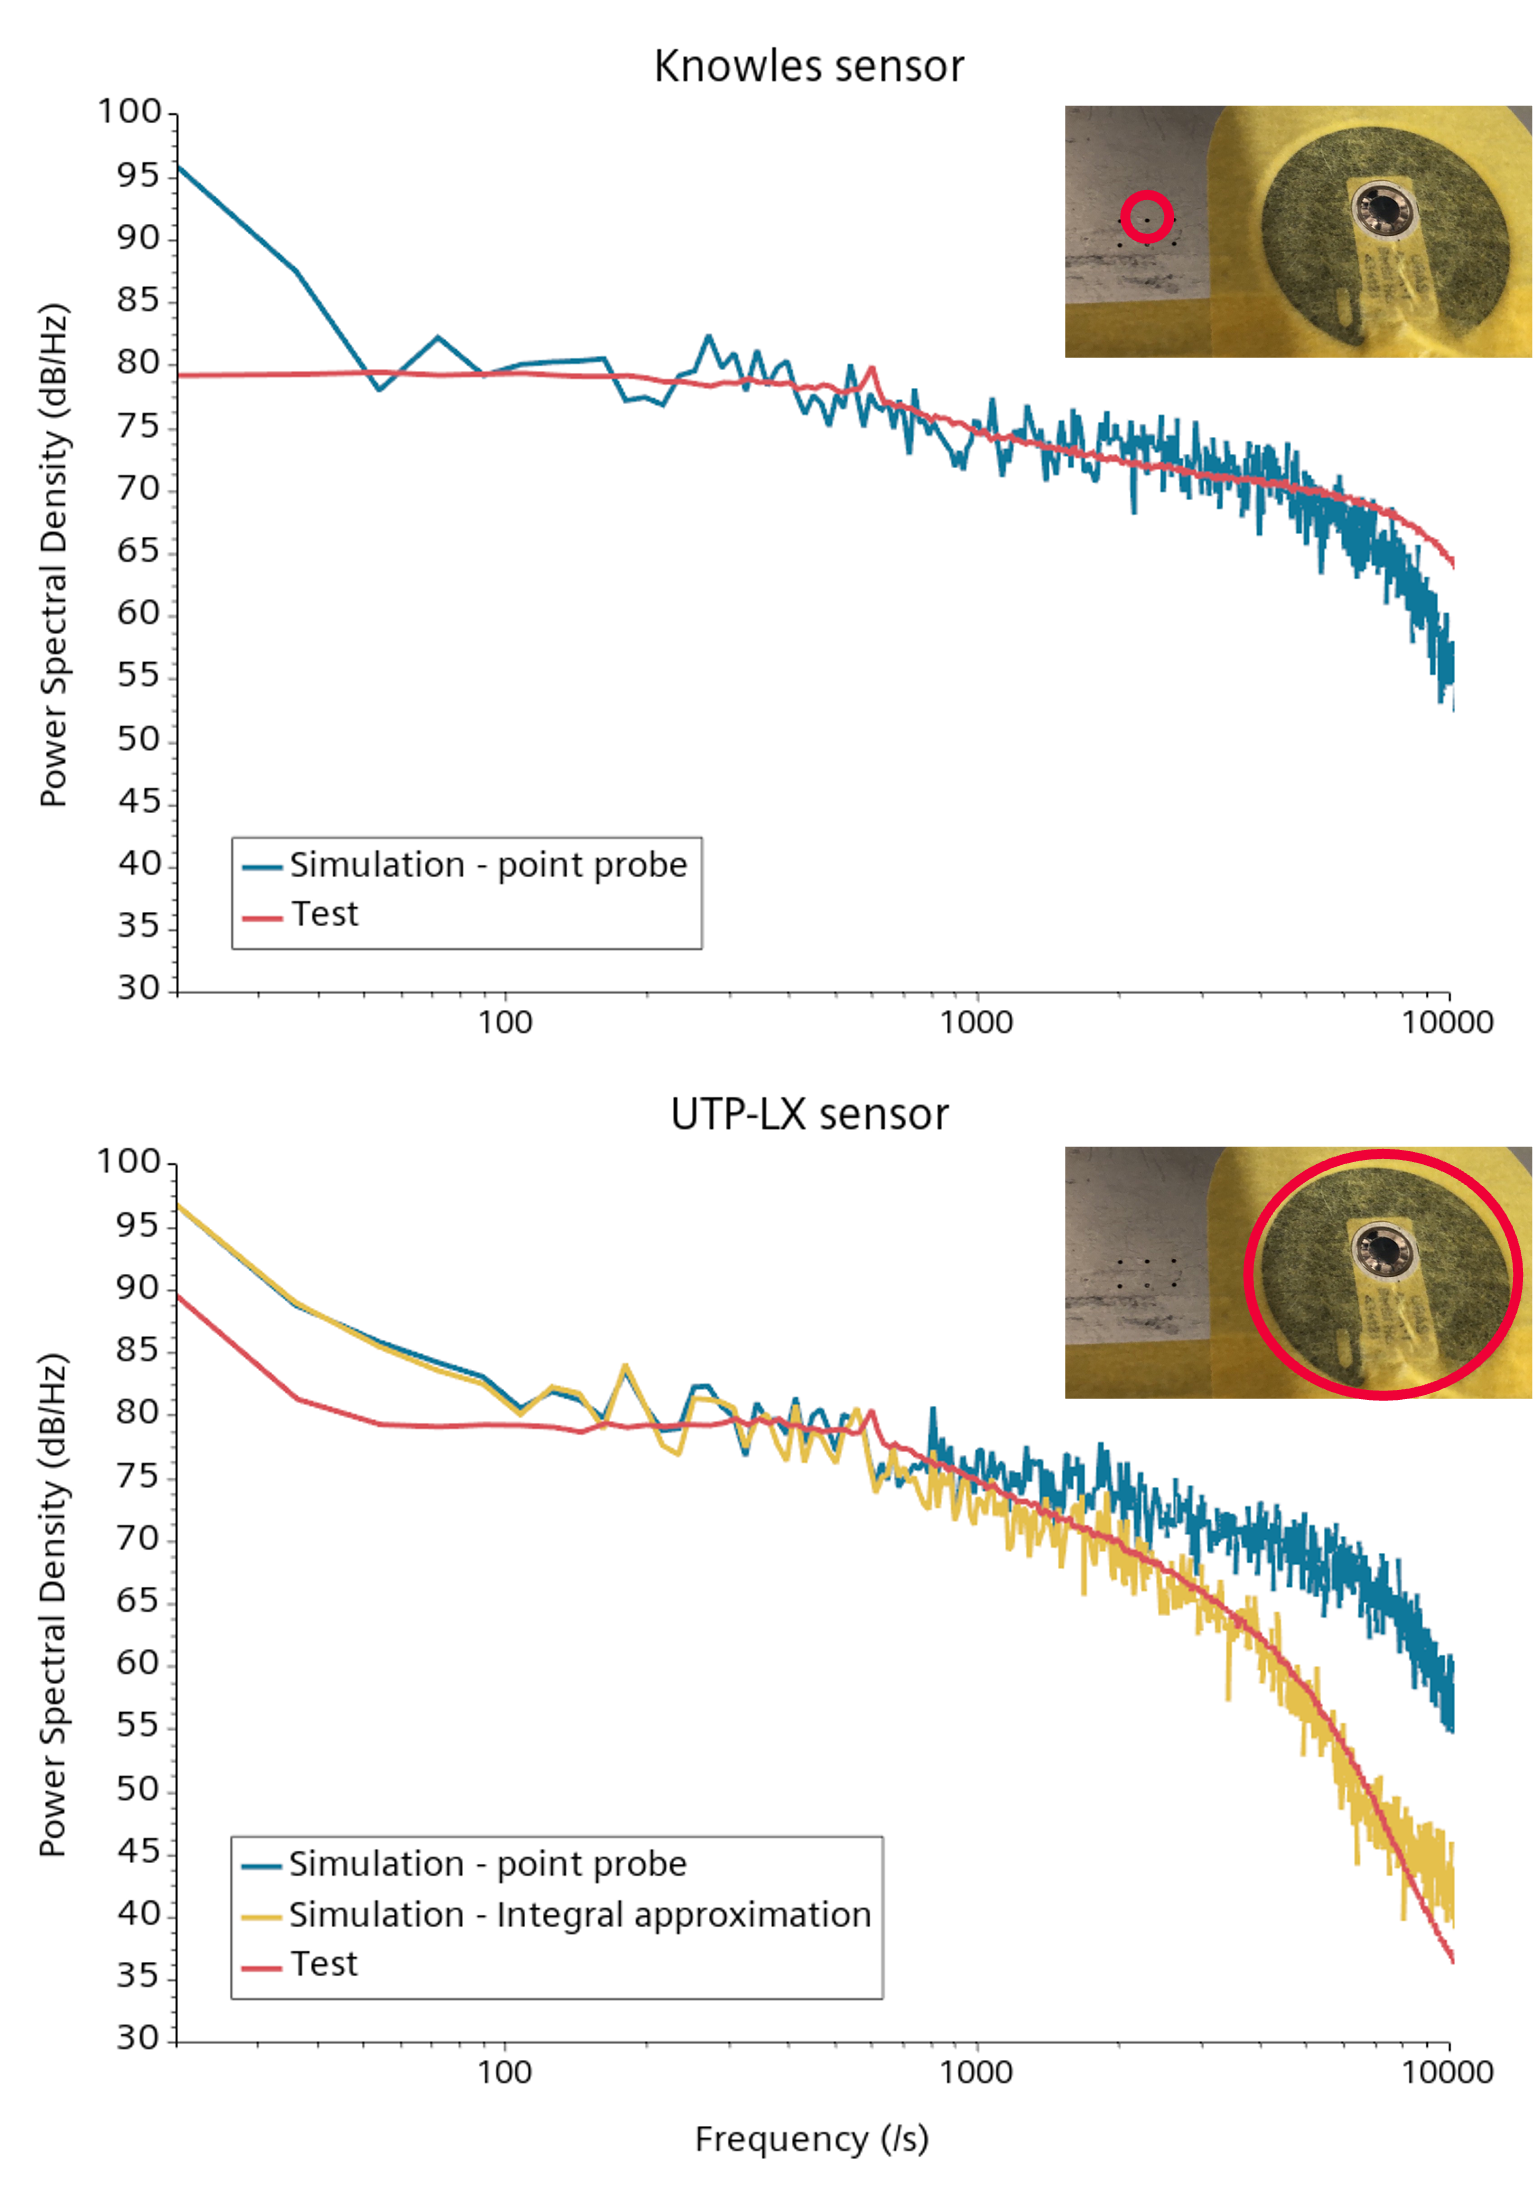
Measured signals approximate the true physical processes, and surface sensor readings are strongly affected by sensor type and size. Sensor choice significantly impacts results, as shown by differences between Knowles and UTP-LX sensors, which capture unsteady pressure differently.

Numerical simulation delivers approximations of 𝑝(𝑠,𝑡) and not of 𝑝_𝑚 (𝑥,𝑡). How to get 𝑝_𝑚 then?
Approximate 𝐾(𝒔)=𝛿(𝒔), i.e. point probe
Approximate using semi-empirical formulas
The side mirror aeroacoustics template tries to approximate the sensor membrane response but uncertainties remain (such as sensor calibration errors or mounting effects)
Post-processing Results
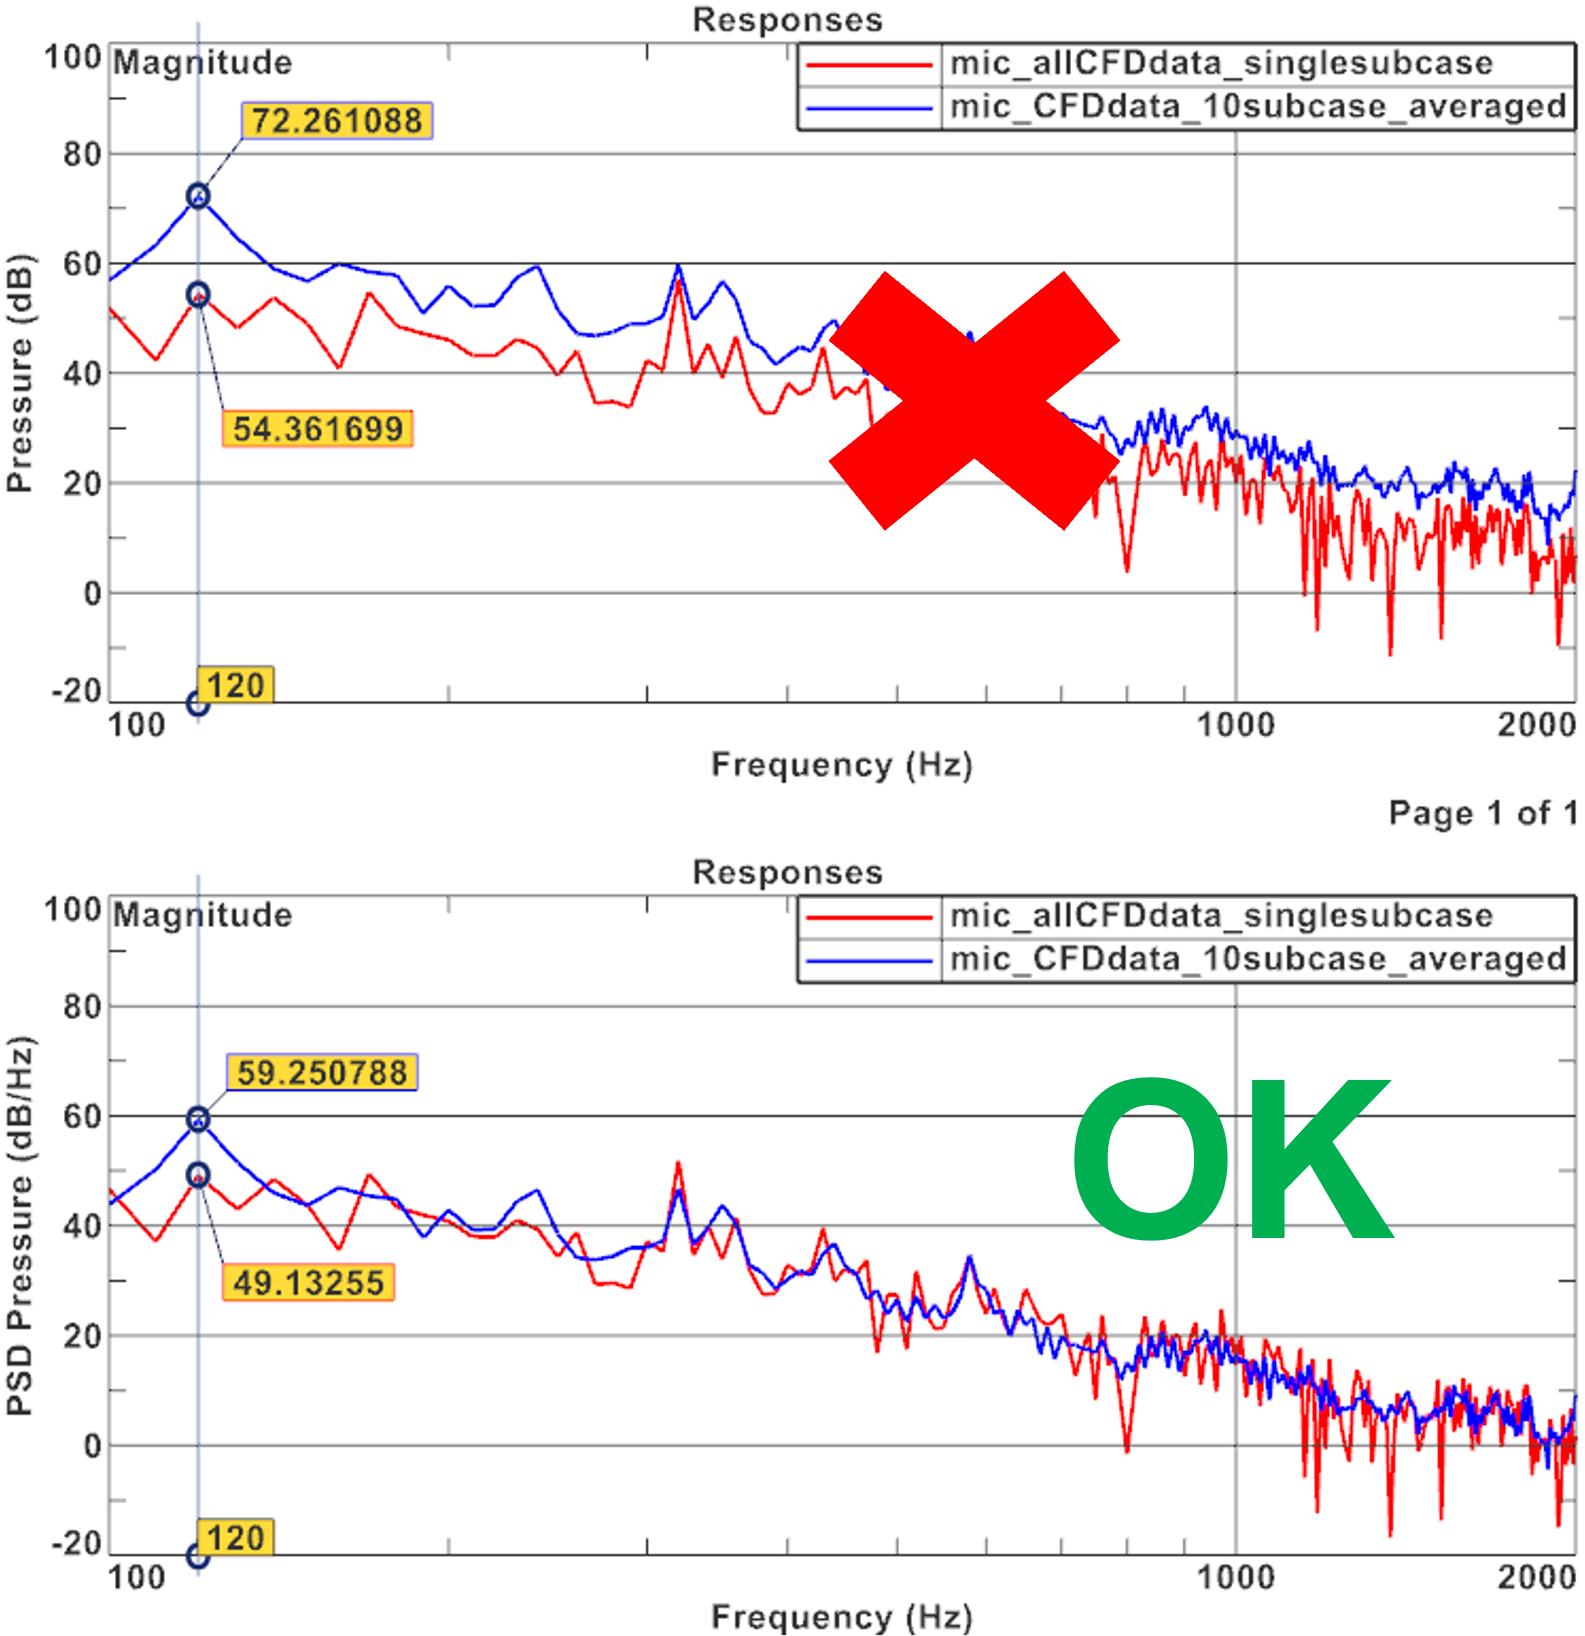
CFD simulations cover short physical times (~0.3 s), giving ~3.33 Hz frequency resolution. Raw auto-spectrum or PSD plots are noisy due to turbulence, so averaging is needed. Splitting the signal into 0.05 s blocks with 50% overlap creates 10 subcases with 20 Hz resolution; RMS averaging smooths the response. Offsets in auto-spectrum (top) plots arise from frequency resolution differences, so comparisons should use PSD (bottom) plots. Always compare signals with different frequency resolutions in PSD to avoid misleading results.
Author